Rockbuster Stealth LLC 📼
Project Date: December 2024
Category: Business Intelligence
Project Overview
Objective: Use historical rental data to inform customer segmentation and content prioritization for Rockbuster’s upcoming streaming service.
Data: SQL-based database including rental transactions, customer demographics, film inventory, and payment data.
Methods:
- Queried and managed relational data using SQL
- Compiled a data dictionary to clarify schema relationships
- Joined tables to unify customer, rental, and film details
- Used subqueries and CTEs for layered insights
Deliverables:
TL;DR
- Rockbuster’s customer data is highly fragmented, with most regions too sparse for traditional geographic segmentation.
- Engagement drops significantly as customer tenure increases—highlighting a retention gap.
- A surprising 25%+ of revenue comes from late fees, posing a major risk in the streaming transition.
- Exploratory analysis suggests opportunity in tiered pricing based on behavioral clusters, but small-sample volatility is a persistent issue.
Recommendation: Prioritize behavioral segmentation over geography, shift away from late-fee reliance, and pilot loyalty-focused streaming plans.
Key Insights
1. Customer Fragmentation: Signal vs. Noise in Geographic Trends
Challenge: 87% of countries and 73% of districts have fewer than 10 and 1 customer(s), respectively. Sample sizes are too small for reliable geographic trends.
Solution: Normalize by population and tenure using a behavior-adjusted engagement rate (rentals per active customer month).
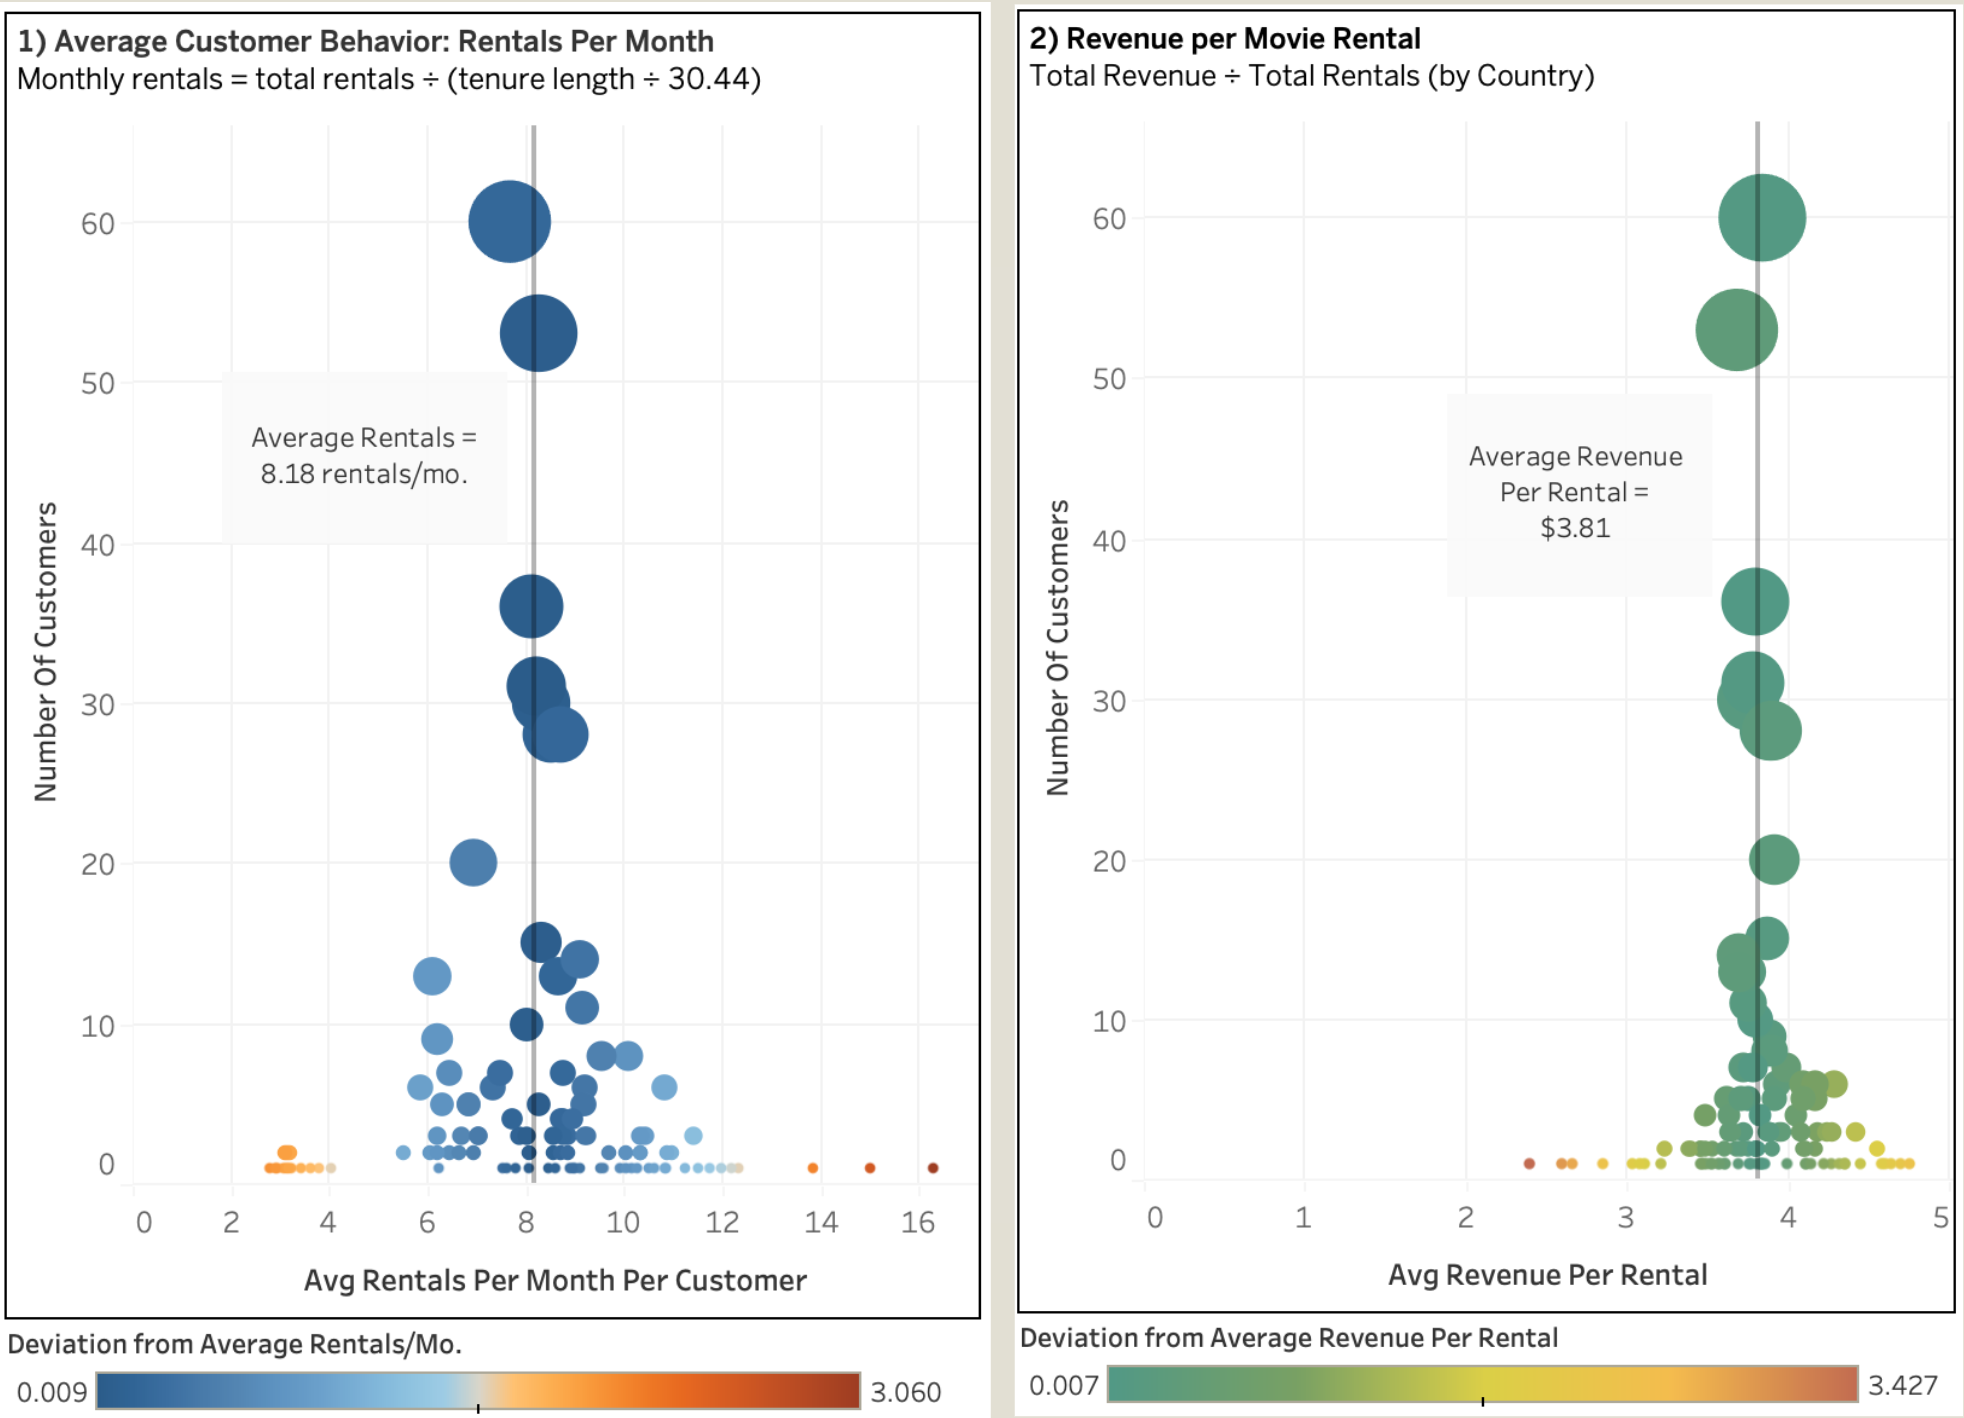
FIG. A: Customer behavior normalized by month: rentals per customer (left); revenue per rental (right)
Key Benchmarks:
- Avg. monthly rentals per customer: 8.18
- Avg. revenue per rental: $3.81
2. Customer Tenure vs. Engagement
Critical Finding: Clear negative correlation between tenure and engagement.
As tenure increases, rental frequency declines—underscoring a need for lifecycle-based retention strategies.
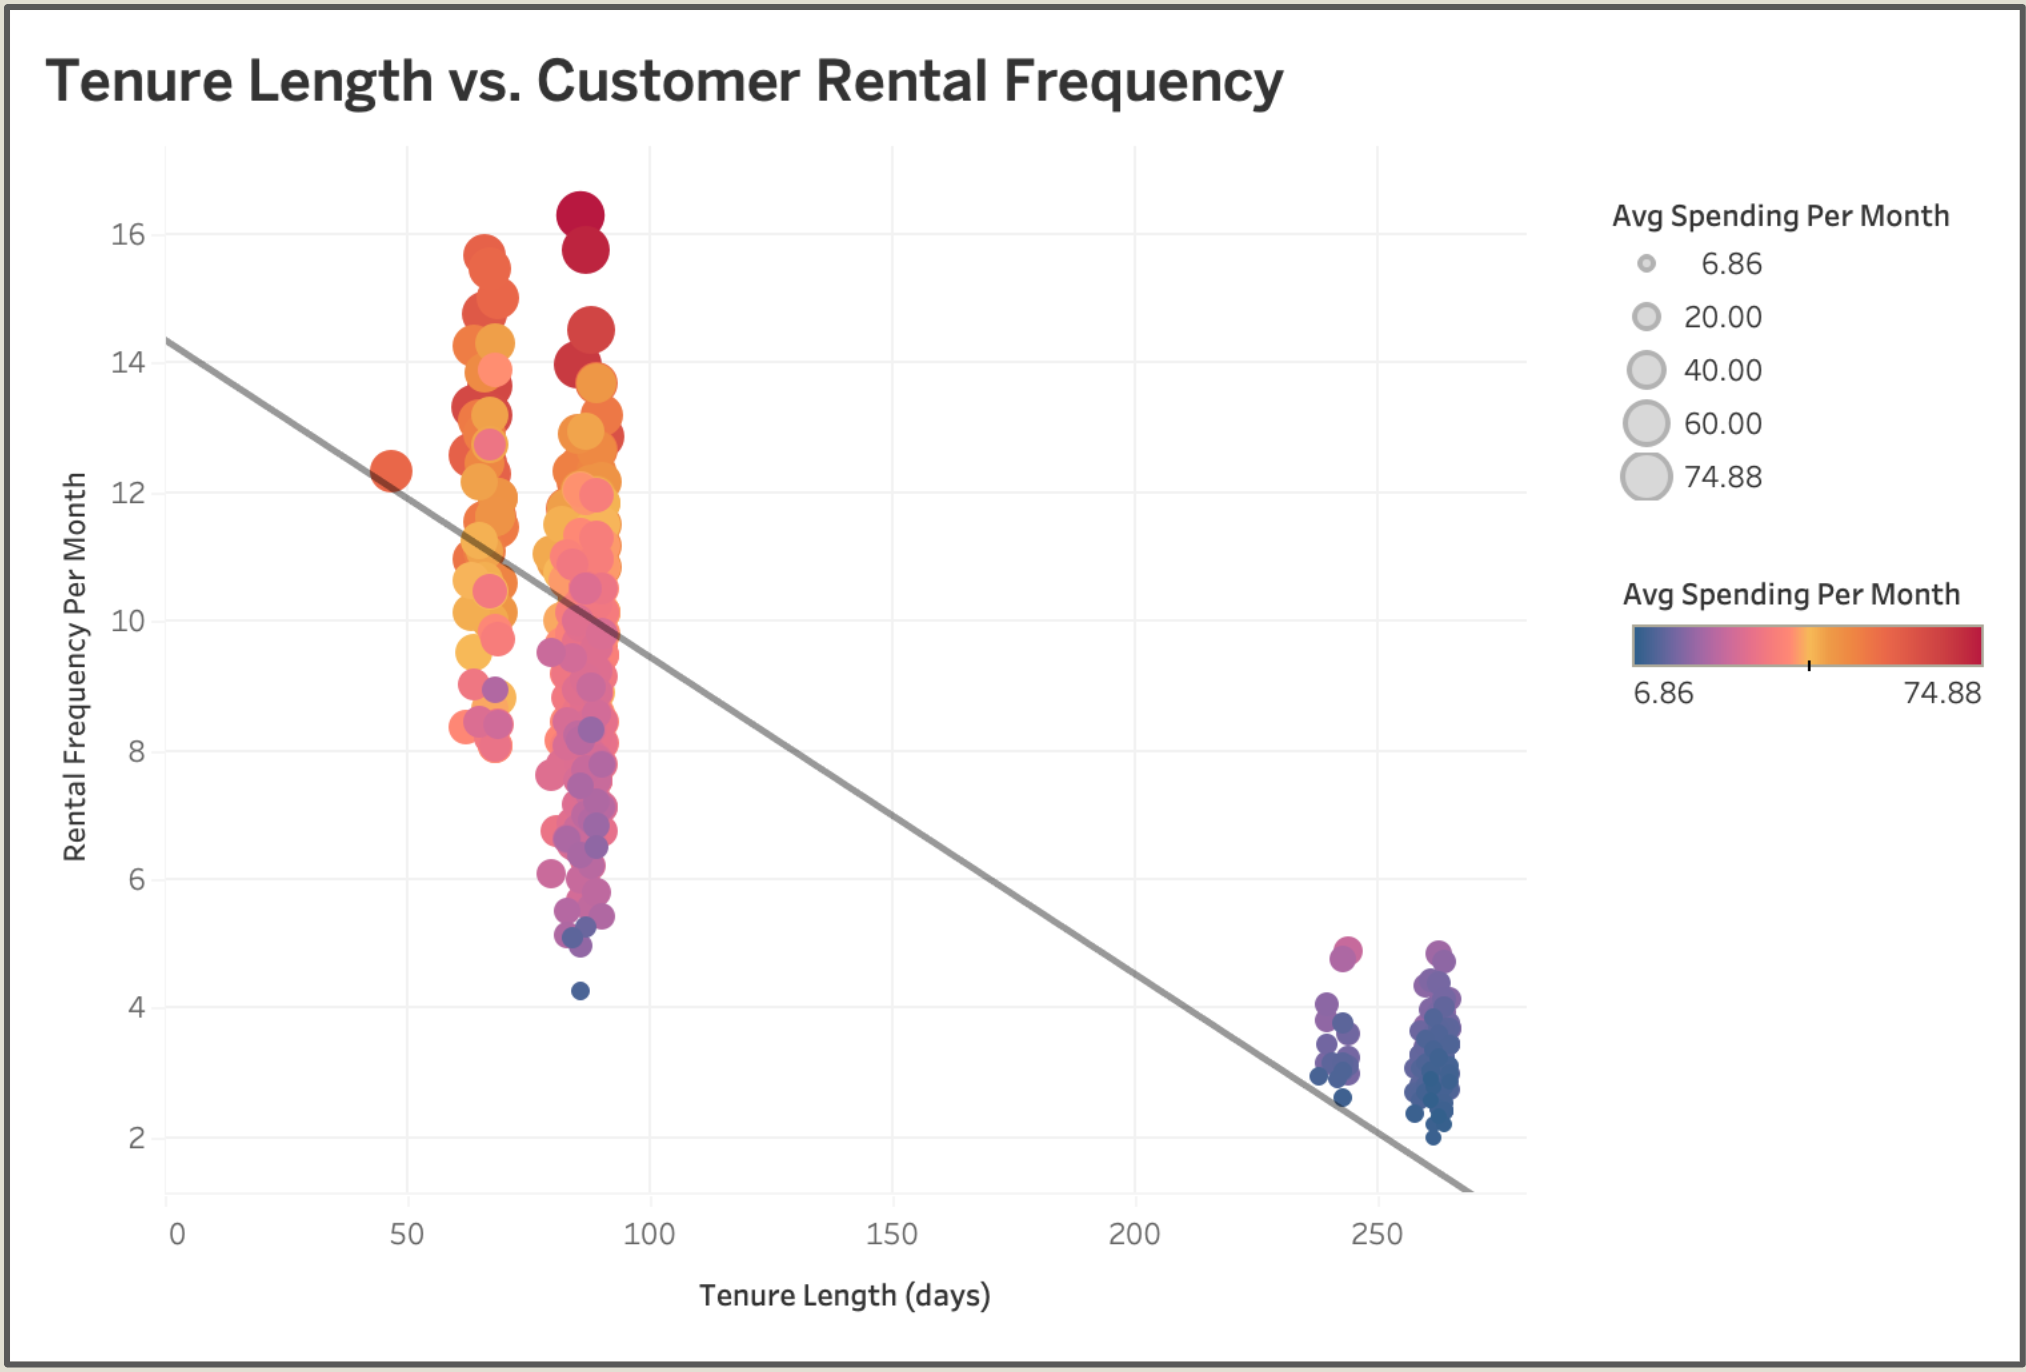
FIG. B: Scatterplot: tenure length (days) vs. monthly rentals, with trend line
3. Revenue Streams: Rentals vs. Late Fees
Concerning Discovery: Over 25% of revenue comes from late fees—not rentals.
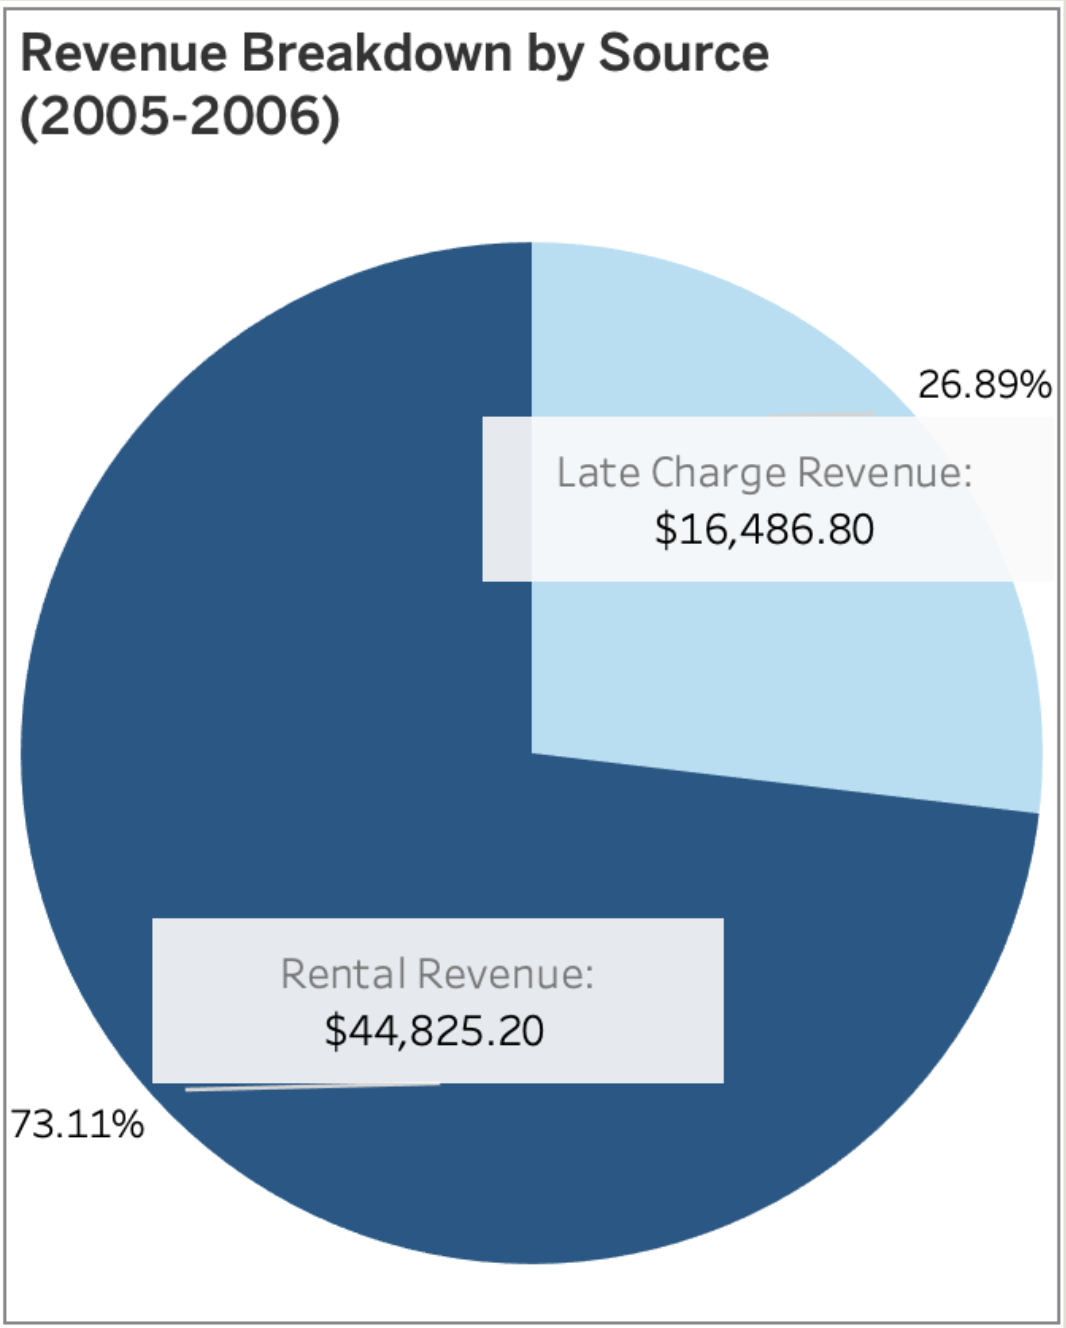
FIG. C: Revenue breakdown: late fees account for more than a quarter of total revenue
Implications:
- Revenue model is penalty-heavy, not usage-driven
- Late fees won’t translate to streaming—requires major shift
Bonus Insight: Toward Tiered Pricing Strategy
Identifying behavioral clusters that could inform subscription tiers and loyalty offers.
To explore future monetization opportunities, we examined rental behavior patterns for signals that might support a tiered pricing model in the upcoming streaming transition.
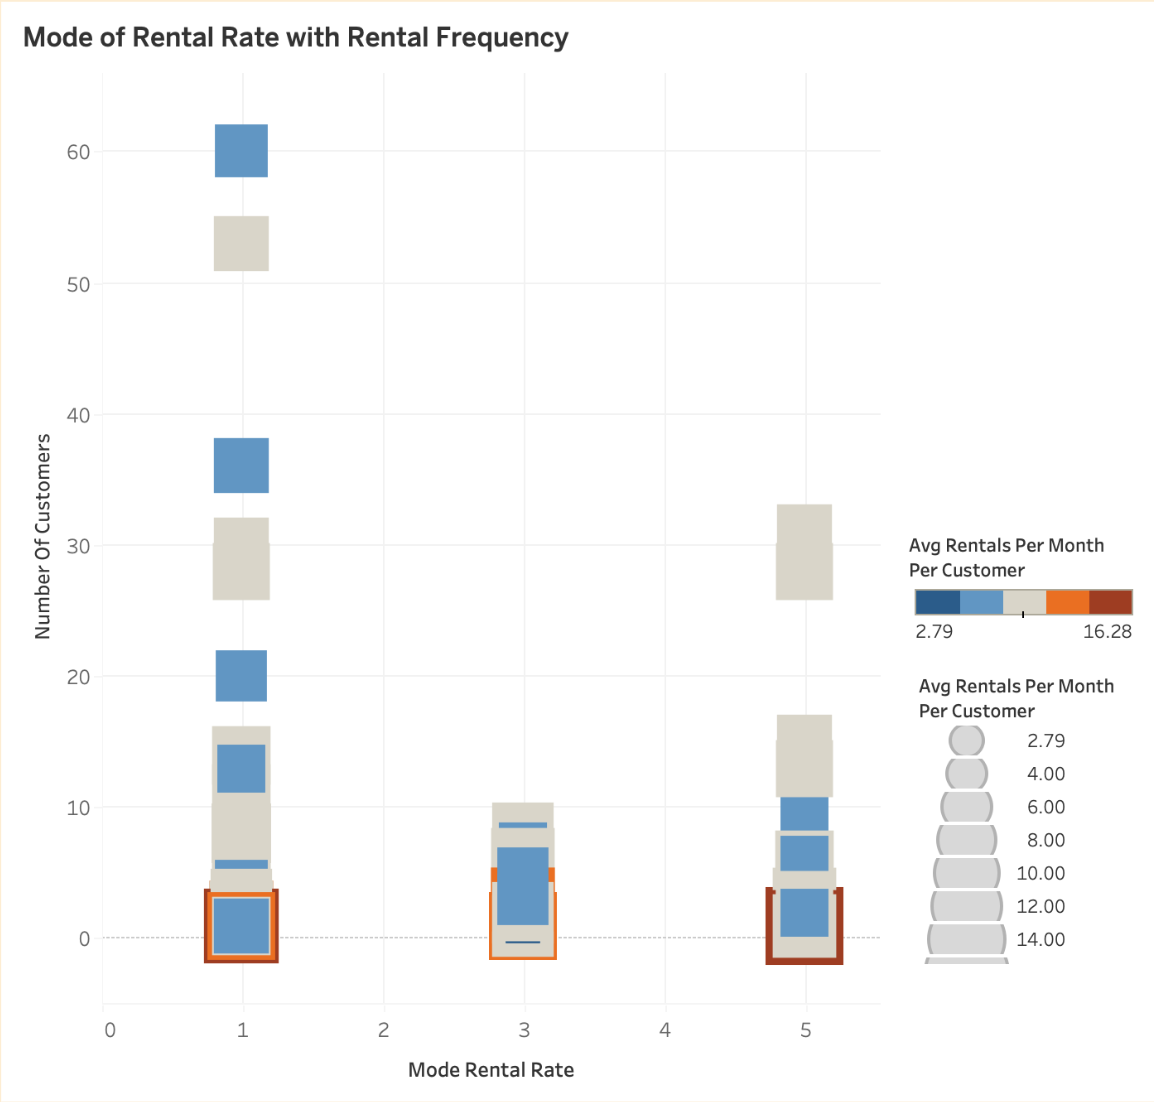
FIG. D: Mode rental rate vs. rental frequency, segmented by customer and market size. Red = high frequency; grey = low frequency.
Highlights:
- Regions with $0.99 rental mode extend up to ~60 customers.
- $2.99 and $4.99 mode pricing clusters suggest mid-volume regional segments.
- High-frequency users tend to be geographically isolated (low on Y-axis, red dots)—suggesting strong but non-scalable usage patterns.
Caveats:
- Mode may not reflect strength of preference—e.g., one additional rental could flip the dominant price.
- Sample sizes are small; volatility risks overfitting pricing tiers to anomalies.
- Stronger modeling may emerge by combining Rental Frequency × Price Mode × Segment Size into a single weighted cluster.
Future Opportunity:
Could clustering or regression methods help identify stable, behavior-based tiers? Further work could integrate churn analysis or forecast retention under different pricing models.
Recommendations
1. Focus on Platform Offerings
Geographic targeting is unreliable. Instead, expand inventory in top-performing genres (by rental revenue/title): Sci-Fi, Action, Animation.
2. Address the Tenure Drop-Off
Introduce subscription plans and loyalty rewards to stabilize engagement over time.
3. Move Beyond Late Fees
Pivot away from penalty-driven revenue with tiered streaming plans that align with behavioral segments.
Tools Used: SQL, Tableau
Skills Demonstrated: Complex Queries, Data Normalization, Market Segmentation, Business Model Assessment