Bank Churn Prediction 💰
Project Date: February 2025
Category: Business Intelligence
Project Overview
Objective: Identify top predictors of customer churn and build an interpretable model to support retention strategy.
Data: Proprietary customer dataset (age, credit score, balance, tenure, etc.)
Methods:
- Churn-weighted feature scoring
- Volatility ranking via standard deviation
- Manual decision tree modeling (Lucidchart)
- Model validation via logical split testing
TL;DR
- Not all high-churn segments are impactful—some groups churn at high rates but represent tiny slivers of the customer base.
- Sensitive or noisy fields (like credit scores and salary) should not always be imputed—sometimes leaving nulls preserves model integrity.
- Churn is concentrated among customers with ≤3 years tenure, 3+ products, and no credit card—these represent the highest-risk profile.
Recommendation: Prioritize outreach to new customers without credit cards, and reinforce loyalty among stable, long-tenure clients.
Key Insights
1. High Churn ≠ High Impact
Insight: Groups with high churn rates may be too small to justify targeted retention campaigns.
Example: Customers aged 31–40 have the highest churn rate, but make up less than 20% of the client base.
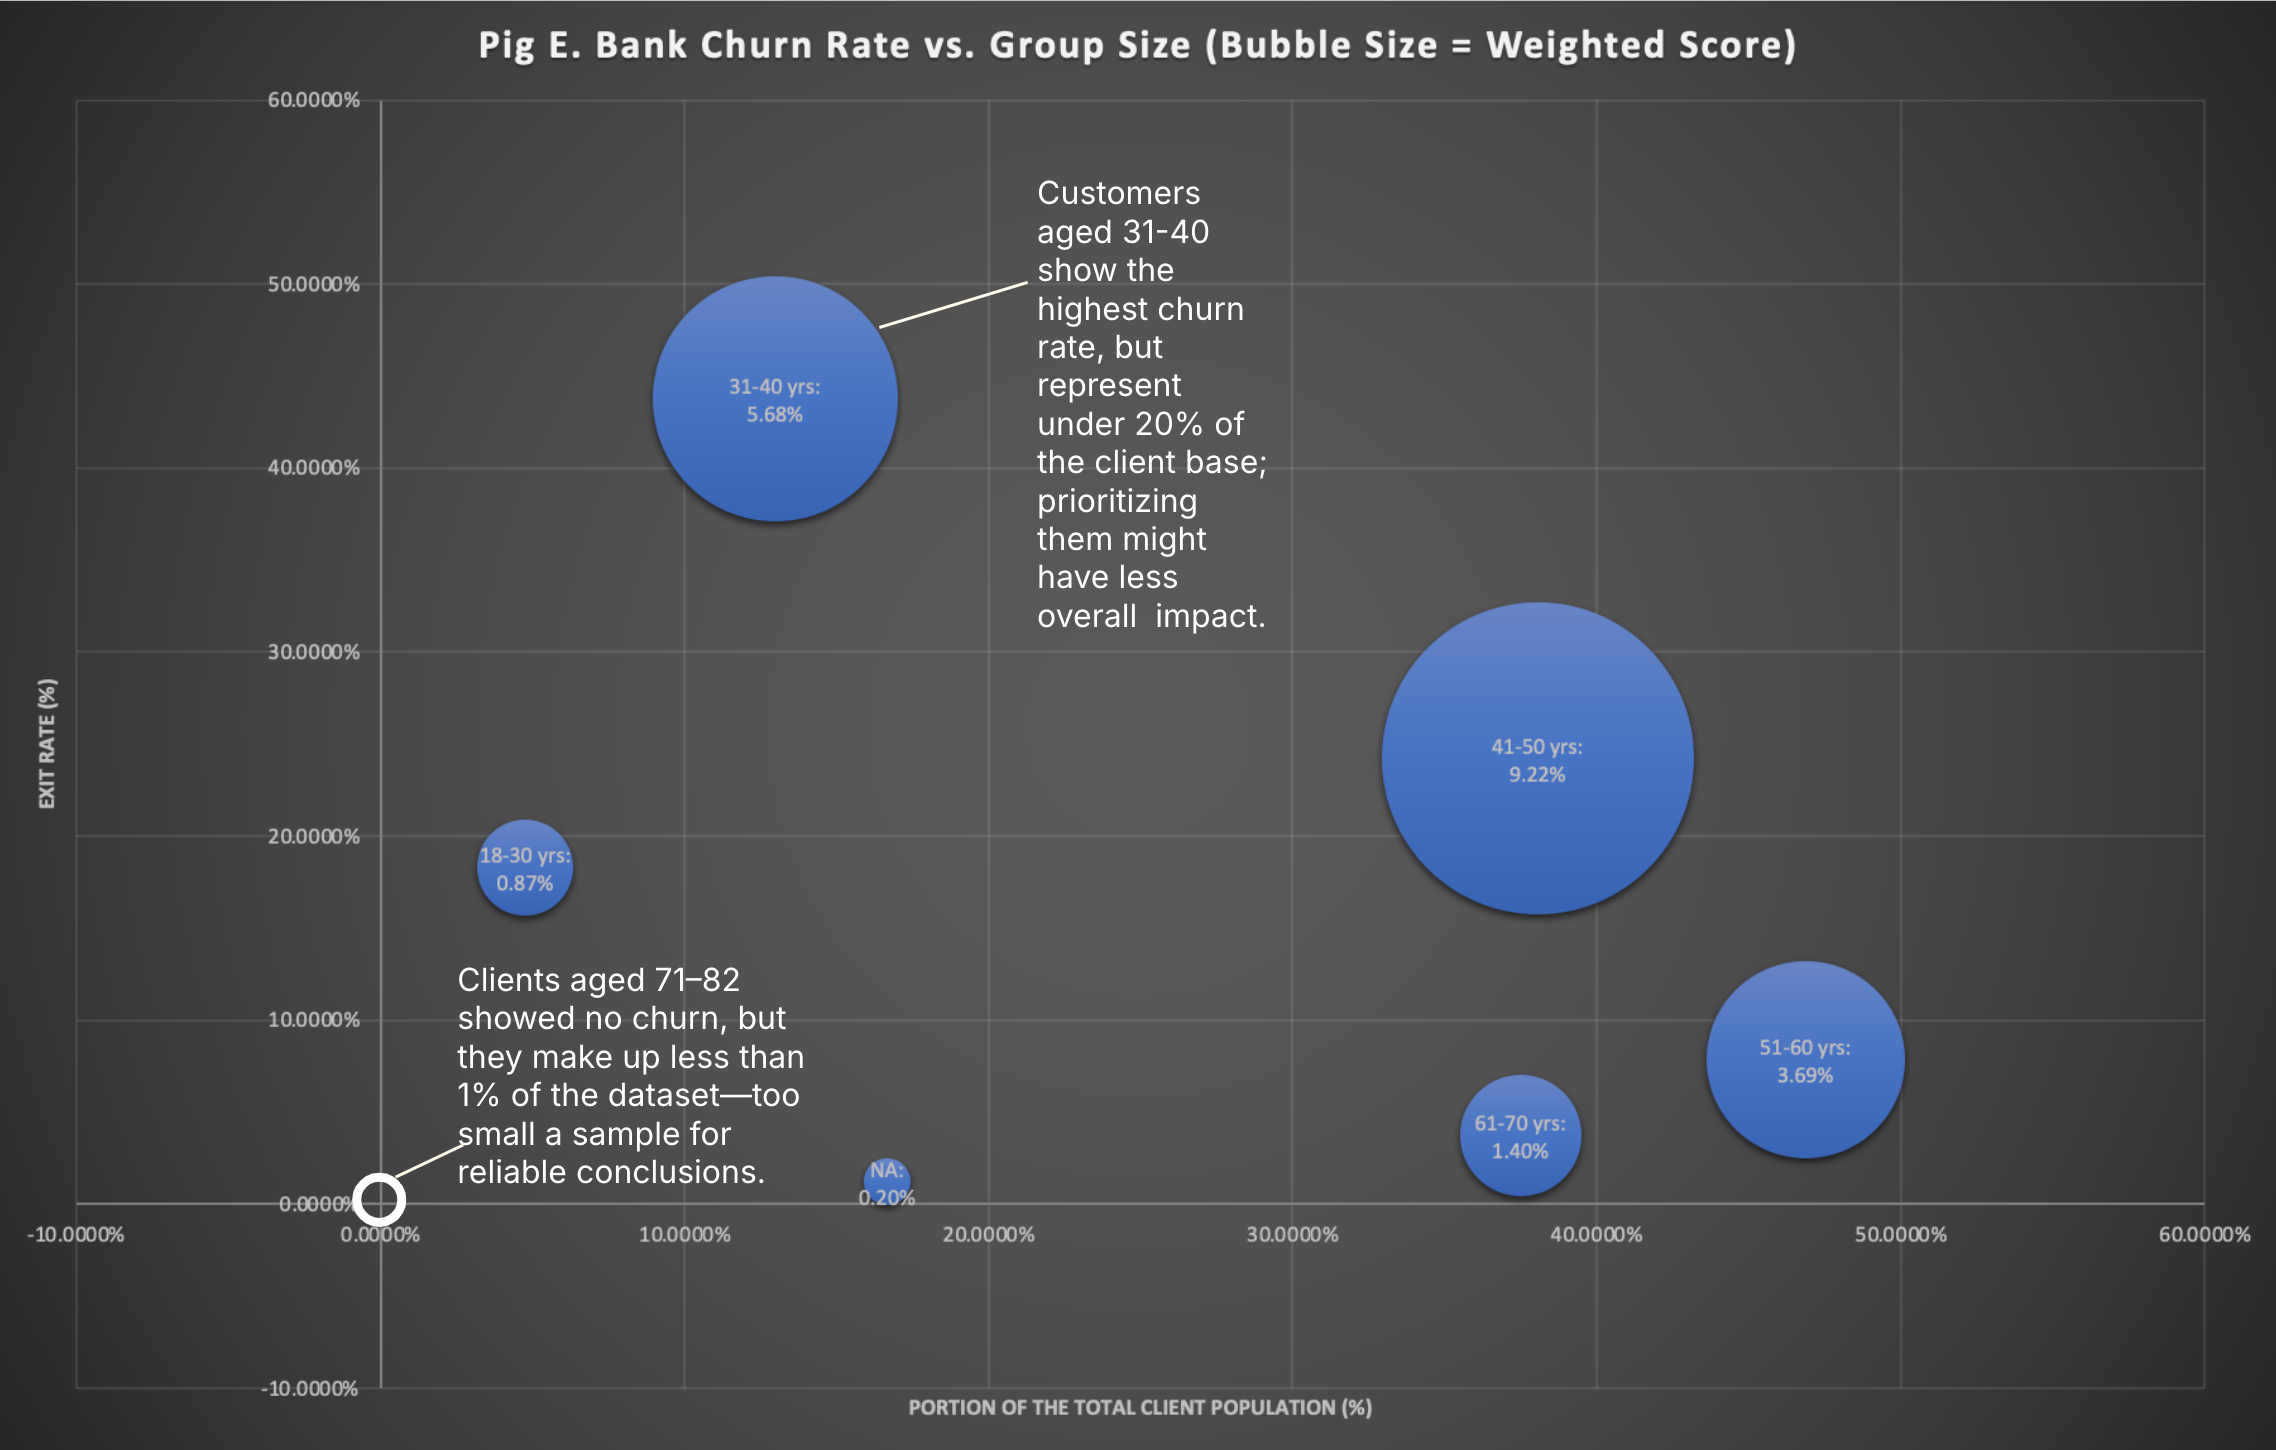
FIG. A: Each group’s “weighted score” multiplies churn rate by population share, to emphasize scalable risk.
⚠️ Statistical Caveat: Zero-churn groups (e.g. clients aged 71–82) are too small (<1%) for reliable modeling.
2. Don’t Always Impute—Especially for Noisy or Sensitive Variables
Credit Score: Skipped imputation—statistically opaque, ethically fraught.
Estimated Salary:
- Tried subgroup-based fill (e.g. by gender or country)
- Small sample sizes + high variance made imputation noisy
- Linear regression ruled out (R² = 0.001 with Balance)
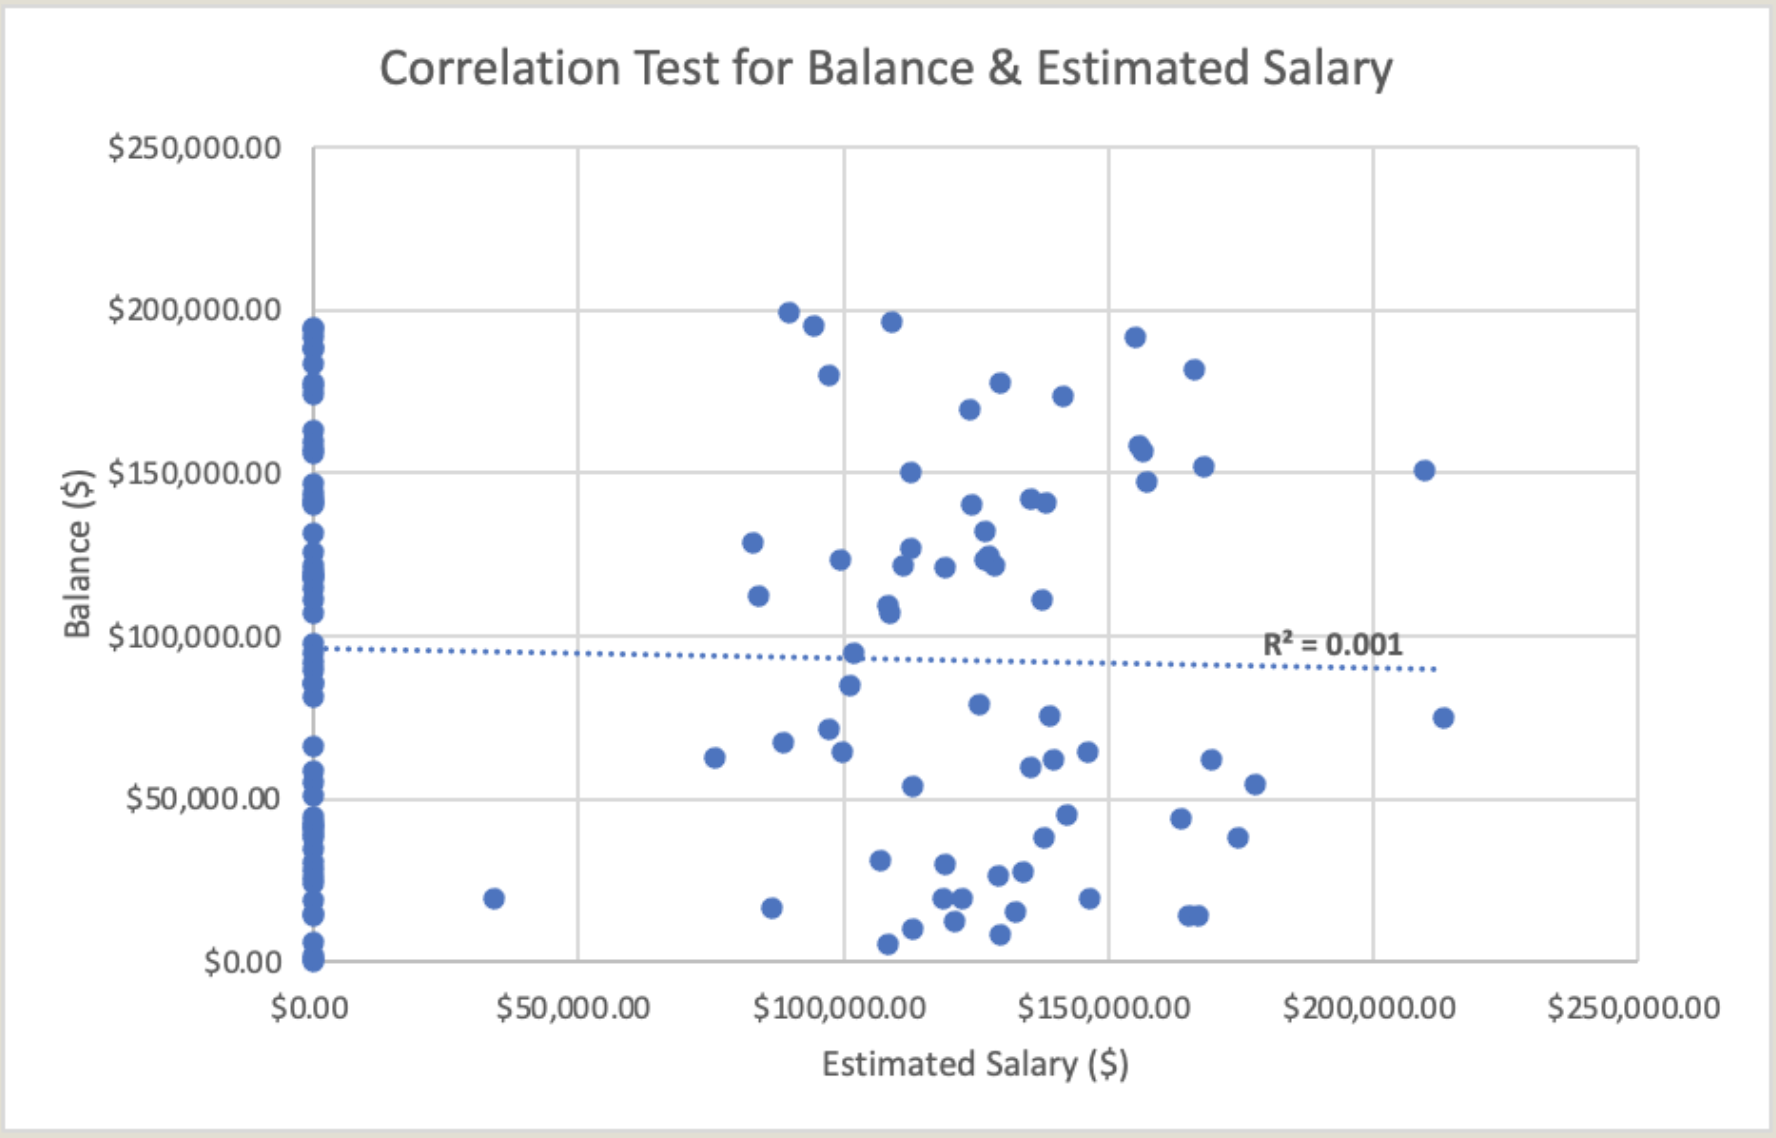
FIG. B: No meaningful relationship between Estimated Salary and Balance (R² = 0.001)
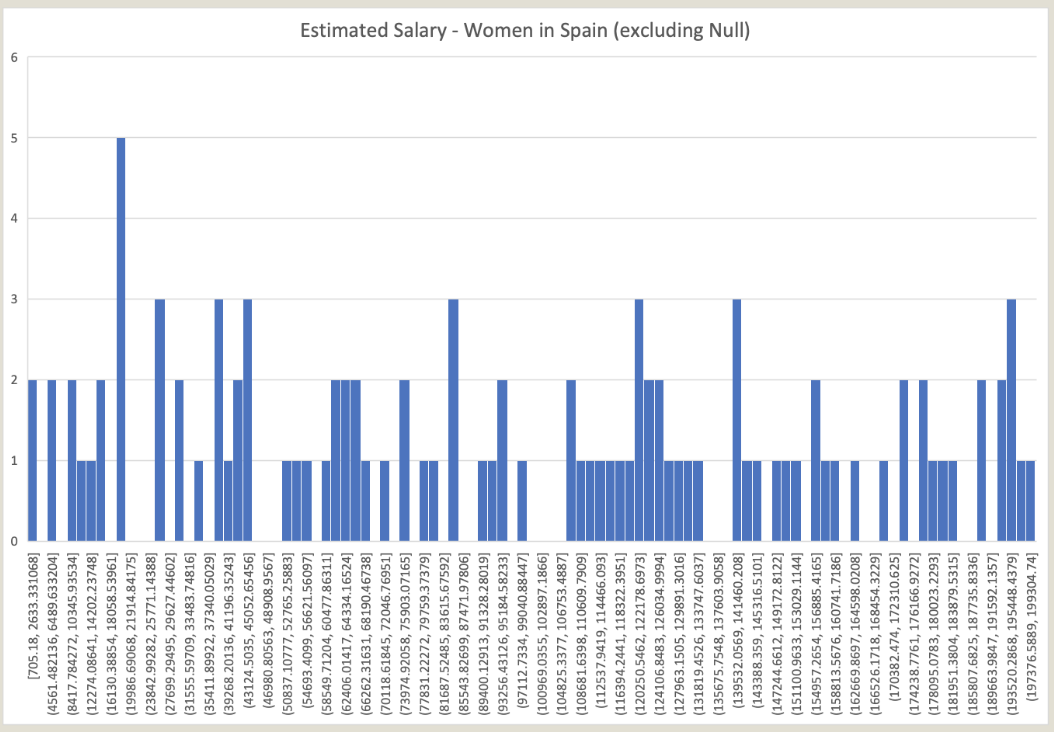
FIG. C: Histogram of salaries for Spanish women—no clear pattern emerged to support fill-in.
➡️ Decision: Leave NA values as-is to avoid introducing noise or false certainty.
3. Top Churn Risk = No Credit Card + 3+ Products + ≤3 Years Tenure
Tree Logic:
- Split features by churn standard deviation (proxy for information gain)
- Balanced sample sizes across branches for interpretability and validation
Highest-Risk Group:
- No credit card
- 3+ products
- ≤3 years tenure
Other patterns:
- Ages 41–50 had highest weighted churn score
- 31–40 group: close second in churn and largest overall segment
- Low-tenure customers outside that age range still showed 66% churn
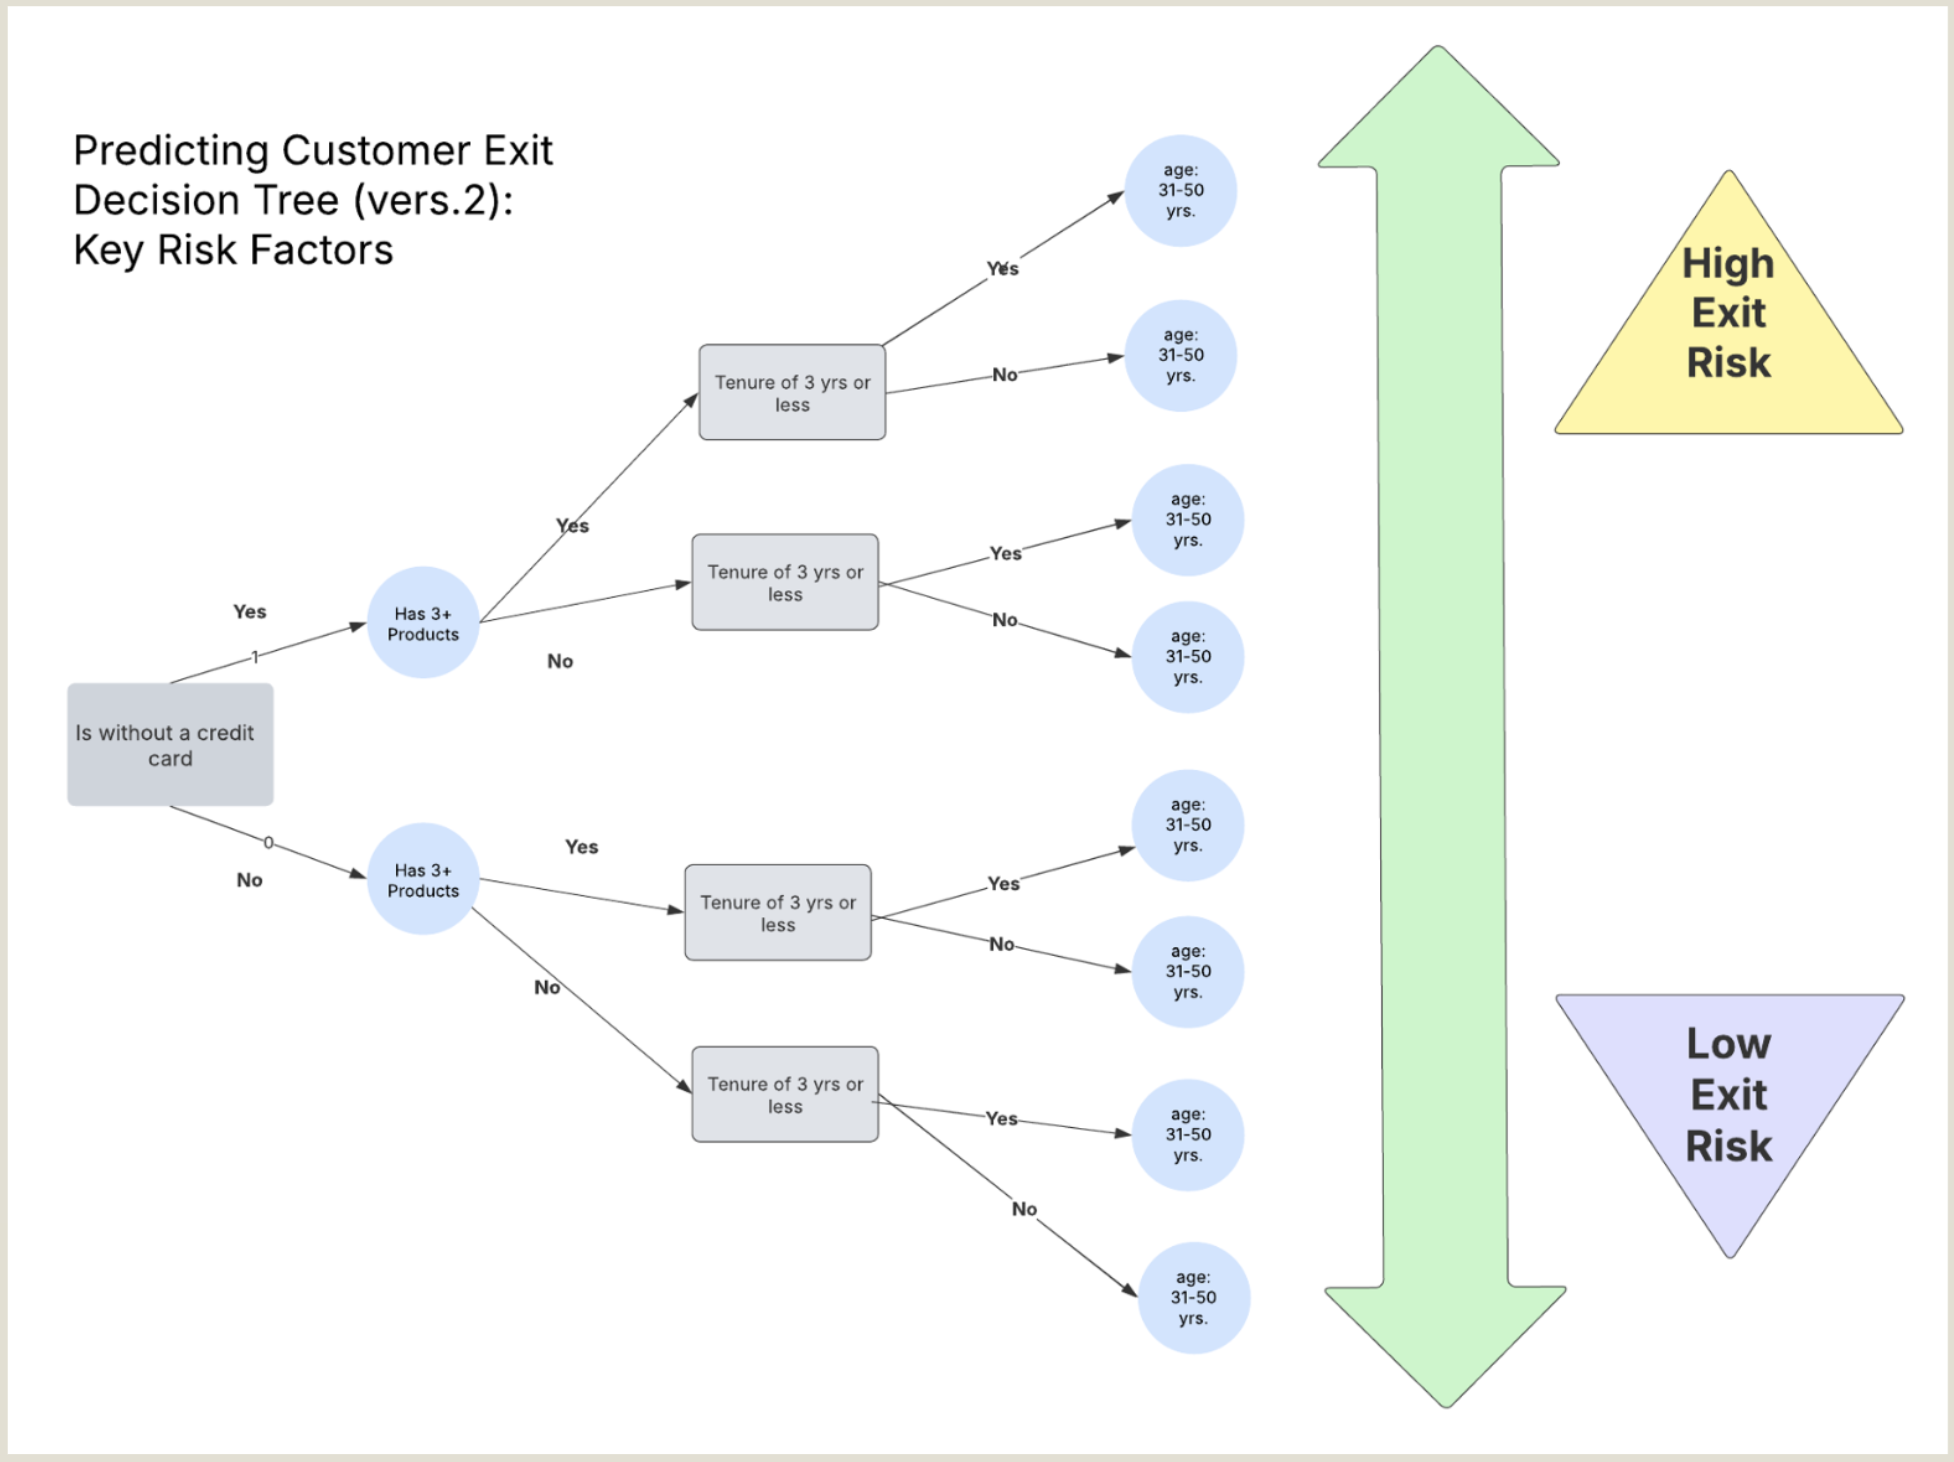
FIG. D: Final model structure based on validated decision splits.
Bonus: Modeling Experiment
Crude Heuristic Test: “Decision Gain”
Idea: Score features by how often their values exceed 50% churn—simple but flawed.
Why It Failed:
- Doesn’t factor in how common each value is
- Ignores population impact
- Flat-scores binary fields
- Misses useful variance within a feature
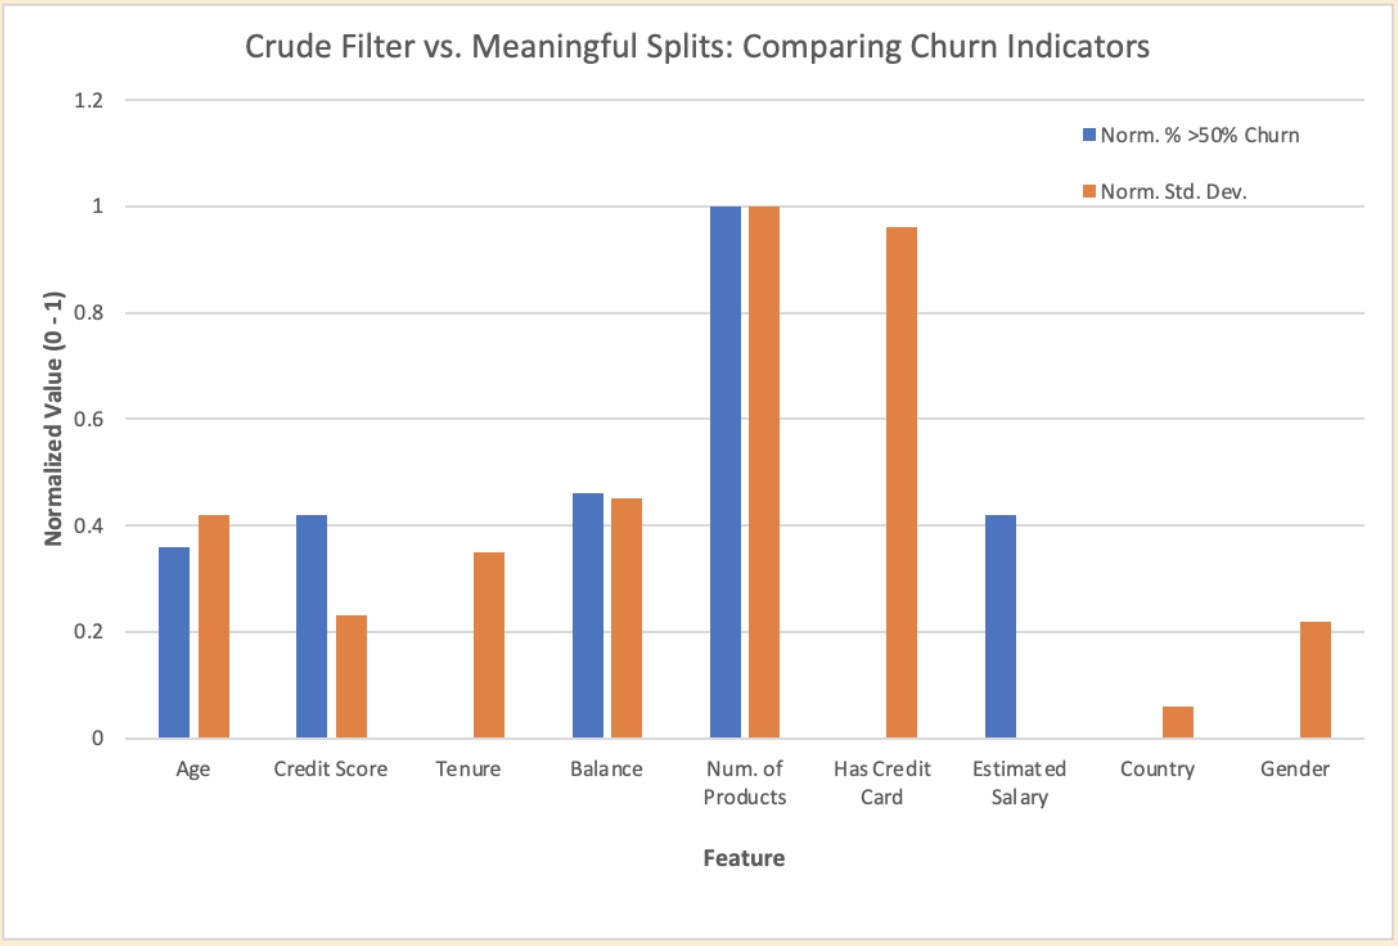
FIG. E: Left: naive “value-over-threshold” filter. Right: properly weighted decision tree scores.
➡️ Takeaway: Early shortcuts can mislead. Standard deviation better captures features with real signal.
Recommendations
1. Use Credit Card Status as a Churn Flag
No-card customers exploring new products represent the highest churn risk.
2. Focus Retention on New Customers (≤3 Years Tenure)
Proactively survey or support this group—early dissatisfaction is high.
3. Reward Long-Tenure, Older Clients
Reinforce loyalty among your most stable customers (50+ years old, high tenure).
Tools Used: Excel, Lucidchart
Skills Demonstrated: Decision Tree Design, Ethical Data Handling, Churn Modeling, Feature Scoring